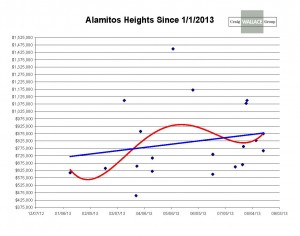
I like graphs, I think a visual story is easier to read then numbers. The first graph shows what sales are doing in Alamitos Heights since January1, 2013.
As you can see, we have an upward trend. This is good news for those who might be thinking about selling.
The second graph is what values have done since 2003. This really tells a story. Locally, we peaked in late 2006/2007, then we did not hit bottom until late 2011.
If you want to know more about what your home is worth, please send me an email. I am Also a Certified Real Estate Appraiser. If you are thinking about selling, please call so we can discuss your options and a marketing plan.


Add a Facebook Comment