Category: Values
Alamitos Heights year end Stats, new Listing coming up.
I have been trying to get this post out for awhile. So, lets not waste anymore time!
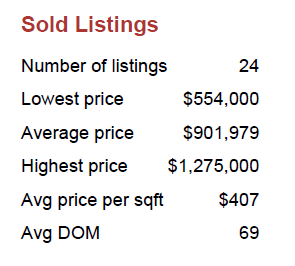
2014 was good year for AlamitosHeights. We had 24 sales. This keeps up with average we have seen over the past few years and is a consistent rise since 2012.
The Lowest price was $554,000 and the highest price was $1,275,000. The average price is $901,979, and the Average Days on Market was 69 days.
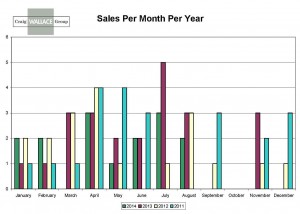
September has the most closed sales with 4. This means these homes were active during the summer “selling months”. However, April, July and December each had 3 closed sales. I think the story here is, if you have a home with good appeal to the market it will sell at any time.
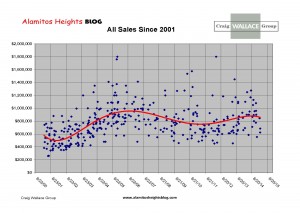
My favorite graph is the one below. This is a historical scatter graph that shows all the sales since 2001. You can really see the ups and downs of the market.
Something I hear all the time from owners is, “ Zillow says my home is worth, such and such” Since I am also a Real Estate Appraiser, I find this chart interesting. I always tell people to lean to the conservative side when looking at a Zillow “Zestimate”. What do you think?
Some of you may have stopped in while I was holding an open house at 750 Havana Avenue. What was confirmed is that there are A lot of people that want to live in AlamitosHeights. If you have thought about selling, now is still a good time.
Speaking of selling; I have a new listing that will be coming on the Market on Orlena Ave. This is a 3 bedroom, 3 bathroom home with a Lap Pool and a Studio off the back of the garage(buyer to verify permits) If you know of anyone looking have the contact me.
3rd Quarter Market Update.
So what has been happening in Alamitos Heights?
I tried a new service from Fiverr.com to make this great little video below. I did not want to use my voice for the voice over, but next time I will. After a few rounds of revisions, the voice over guy just could not get the correct pronunciation of “Alamitos”. I guess when you grow up in Southern California, you are used to the latin pronunciation of words and you don’t have to think about them.
Now for the update.
We seem to be in a state of transition, we are not seeing the rapid price appreciation of years past. We hare heading to a more normal market. Values seem to be hitting a plateau.
( click on picture for larger image)
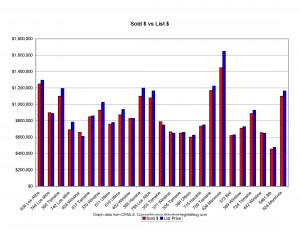
If we look at the List price versus Sold price graph below, we can see that the majority of homes are selling below list price, with a few exceptions. One being 528 Havana Avenue, this solf for $200,000 over asking price! I think it had to do with the fact that this home sits on large lot. The other large lot sale was 680 Havana Avenue. This home could have sold for more, but it is located one house south of 7th Street.
( click on picture for larger image)
This next chart shows us Sales by month, but what we really like to see is the number of sales per year. This year we have 15 closed sales. With the 3 pending and 3 active listings, we could be on track to end the year with 21 sales. This would put us close to sales of the past 3 years.
( click on picture for larger image)
What does all this mean to you? Simple, SELL! If you are thinking about selling, now is the time. If you are thinking about buying, now is the time. Mortgage rates are predicted to move up, and when they do, your purchasing power moves down.
Alamitos Heights, Belmont Park and Belmont Heights.
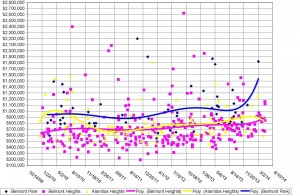
I like to make graphs, they tell a good visual story. While I was on Spring Break with the family, I wanted to do a graph of the surrounding neighborhoods to see how they all relate to each other. I decided to go back 5 years to get a good visual picture. (click on graph for larger image)
As you can see, Belmont Park seems to be trending a little higher then Belmont Heights and Alamitos Heights. What this also shows it that values are still on the rise. We still have a shortage of listings. This is especially true in Alamitos Heights, we have more buyers then sellers.
The most recent closed sales in Alamitos Heights are:
427 Manila Avenue – $949,000 – 4 Bedroom – 2 Bathroom – 2,748 SF – 4,253 SF Lot
359 Panama Avenue – $585,000 – 2 Bedroom – 1 Bathroom – 823 SF – 3,179 SF Lot
There are 5 Active Listings and 2 in Pending/Backup Status.
The highest sale in the Alamitos Heights, BelmontPark, BelmontHeights area was 5041 Vista St. This sold for $1,870,000. It was 3 bedrooms, 2 Full baths, 2 Half Baths, 3,800 SF on a 7,000 SF lot and had a basement/den with a Bar!
If you are thinking about selling your house, and would like to know the current market value or discuss a sales plan, call or email me. If you know someone who wants to move to our wonderful neighborhood, call me, I would be happy to help find them a home. Remember, I am a Long Beach Real Estate Agent, Certified Appraiser, and a resident of Alamitos Heights, Long Beach. I know values. Call me for all your Real Estate needs 562-673-1138
Real Estate agent in Long Beach
Alamitos Heights Real Estate Update
Alamitos Heights Real Estate Update
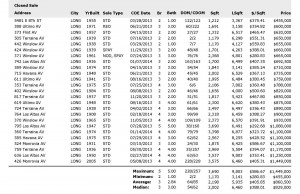
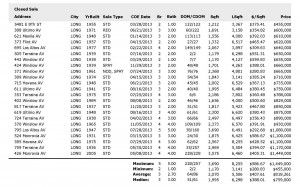
Since March 7, 2013 there have been 25 sales. There were 2 Short Sales and one REO(real estate owned), the rest were Standard sales. The low was 5481 8th Street which sold for $455,000 on January 29,2013. This was a 2 bedroom 1 bath home. The size per public record is 1,212 SF on a 3,367 SF lot. The highest sale was 426 Monrovia Avenue which sold for $1,449,000 on February 27,2013 and was on the market for 228 days. The size per public record is 3,575 SF on a 6,460 SF lot. The most recent closed sale per MLS was 636 Los Altos Avenue. This sold for $1,250,000 on February 27,2014.
(click on Image for larger picture)
There are 6 Active Listings and 1 Pending/Backup per MLS. There are also 2 Pending private trusts sales that were not on the open market. Demand for homes in AlamitosHeights remains strong and values continue to edge up. We are still in a sellers Market.
If you are thinking about selling your home, now is a good time. We are moving into the “home selling season”. If you would like to find out the value of your home or would like to talk about selling it. Please call me, I am a Realtor and Real Estate Appraiser. I have lived in AlamitosHeights since 1996. Call me at 562.673.1138
Alamitos Heights Long Beach – Year End Real Estate Recap
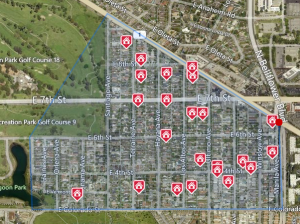
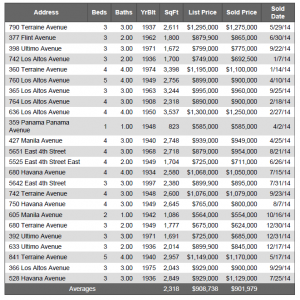
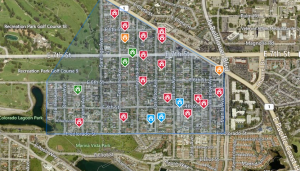
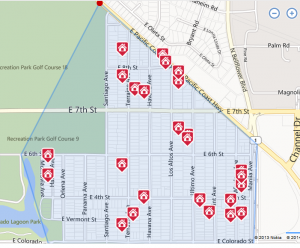
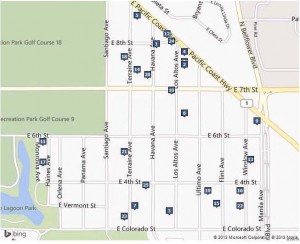
Well, it has been a good year for real estate sales in Alamitos Heights. There were a total of 23 sales this year. ( see map for locations). The sales ranged in price from $455,000 (5481 E. 8th Street) to $1,449,000 (426 Monrovia Ave). This large range shows the diversity of property in Alamitos Heights.
When we graph all the sales for the year, we see a steady increase in values. This is good for Sellers and current homeowners. However, this puts pressure on buyers wanting to move into the neighborhood.
We currently have 6 Active listings, 1 pending sale and 1 in back up status. Of these 8 listings, 5 are on Los Altos Avenue alone! We are going into the new year with about the same amount of listing we had last year. However, the list prices are considerably higher then what was on the market a year ago.
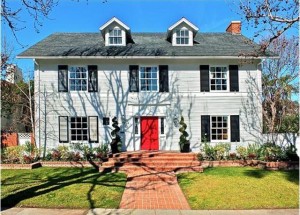
I think the most interesting property on the market at this time is located at 365 Los Altos Avenue. This is a 2 bedroom, 3 bathroom, 3,244 SF home with an indoor pool.
( Click on picture for a larger image)
Please look at the graphs and tables below for more detailed information.
If you know of anyone looking to buy or if you are interested in selling Please contact me. If would like to know the current value of your home, please call me at 562-673-1138, or email me at craig@craigwallacegroup.com.
I have been a resident of AlamitosHeights since 1996. I am Realtor, and a Certified Real Estate Appraiser. I know Values!
( Click on picture for a larger image)
When is a good time to Sell in Alamitos Heights?
So when is the best time to sell? That depends on you and your needs. But, some times of the year are better then others.
Typically the most sales happen from spring through summer. This is considered the “Home Buying Season”, the weather is nice, spring flowers begin to bloom, and the trees are starting to get leaves. Buyers might have been thinking about moving in the winter and are now actively looking.
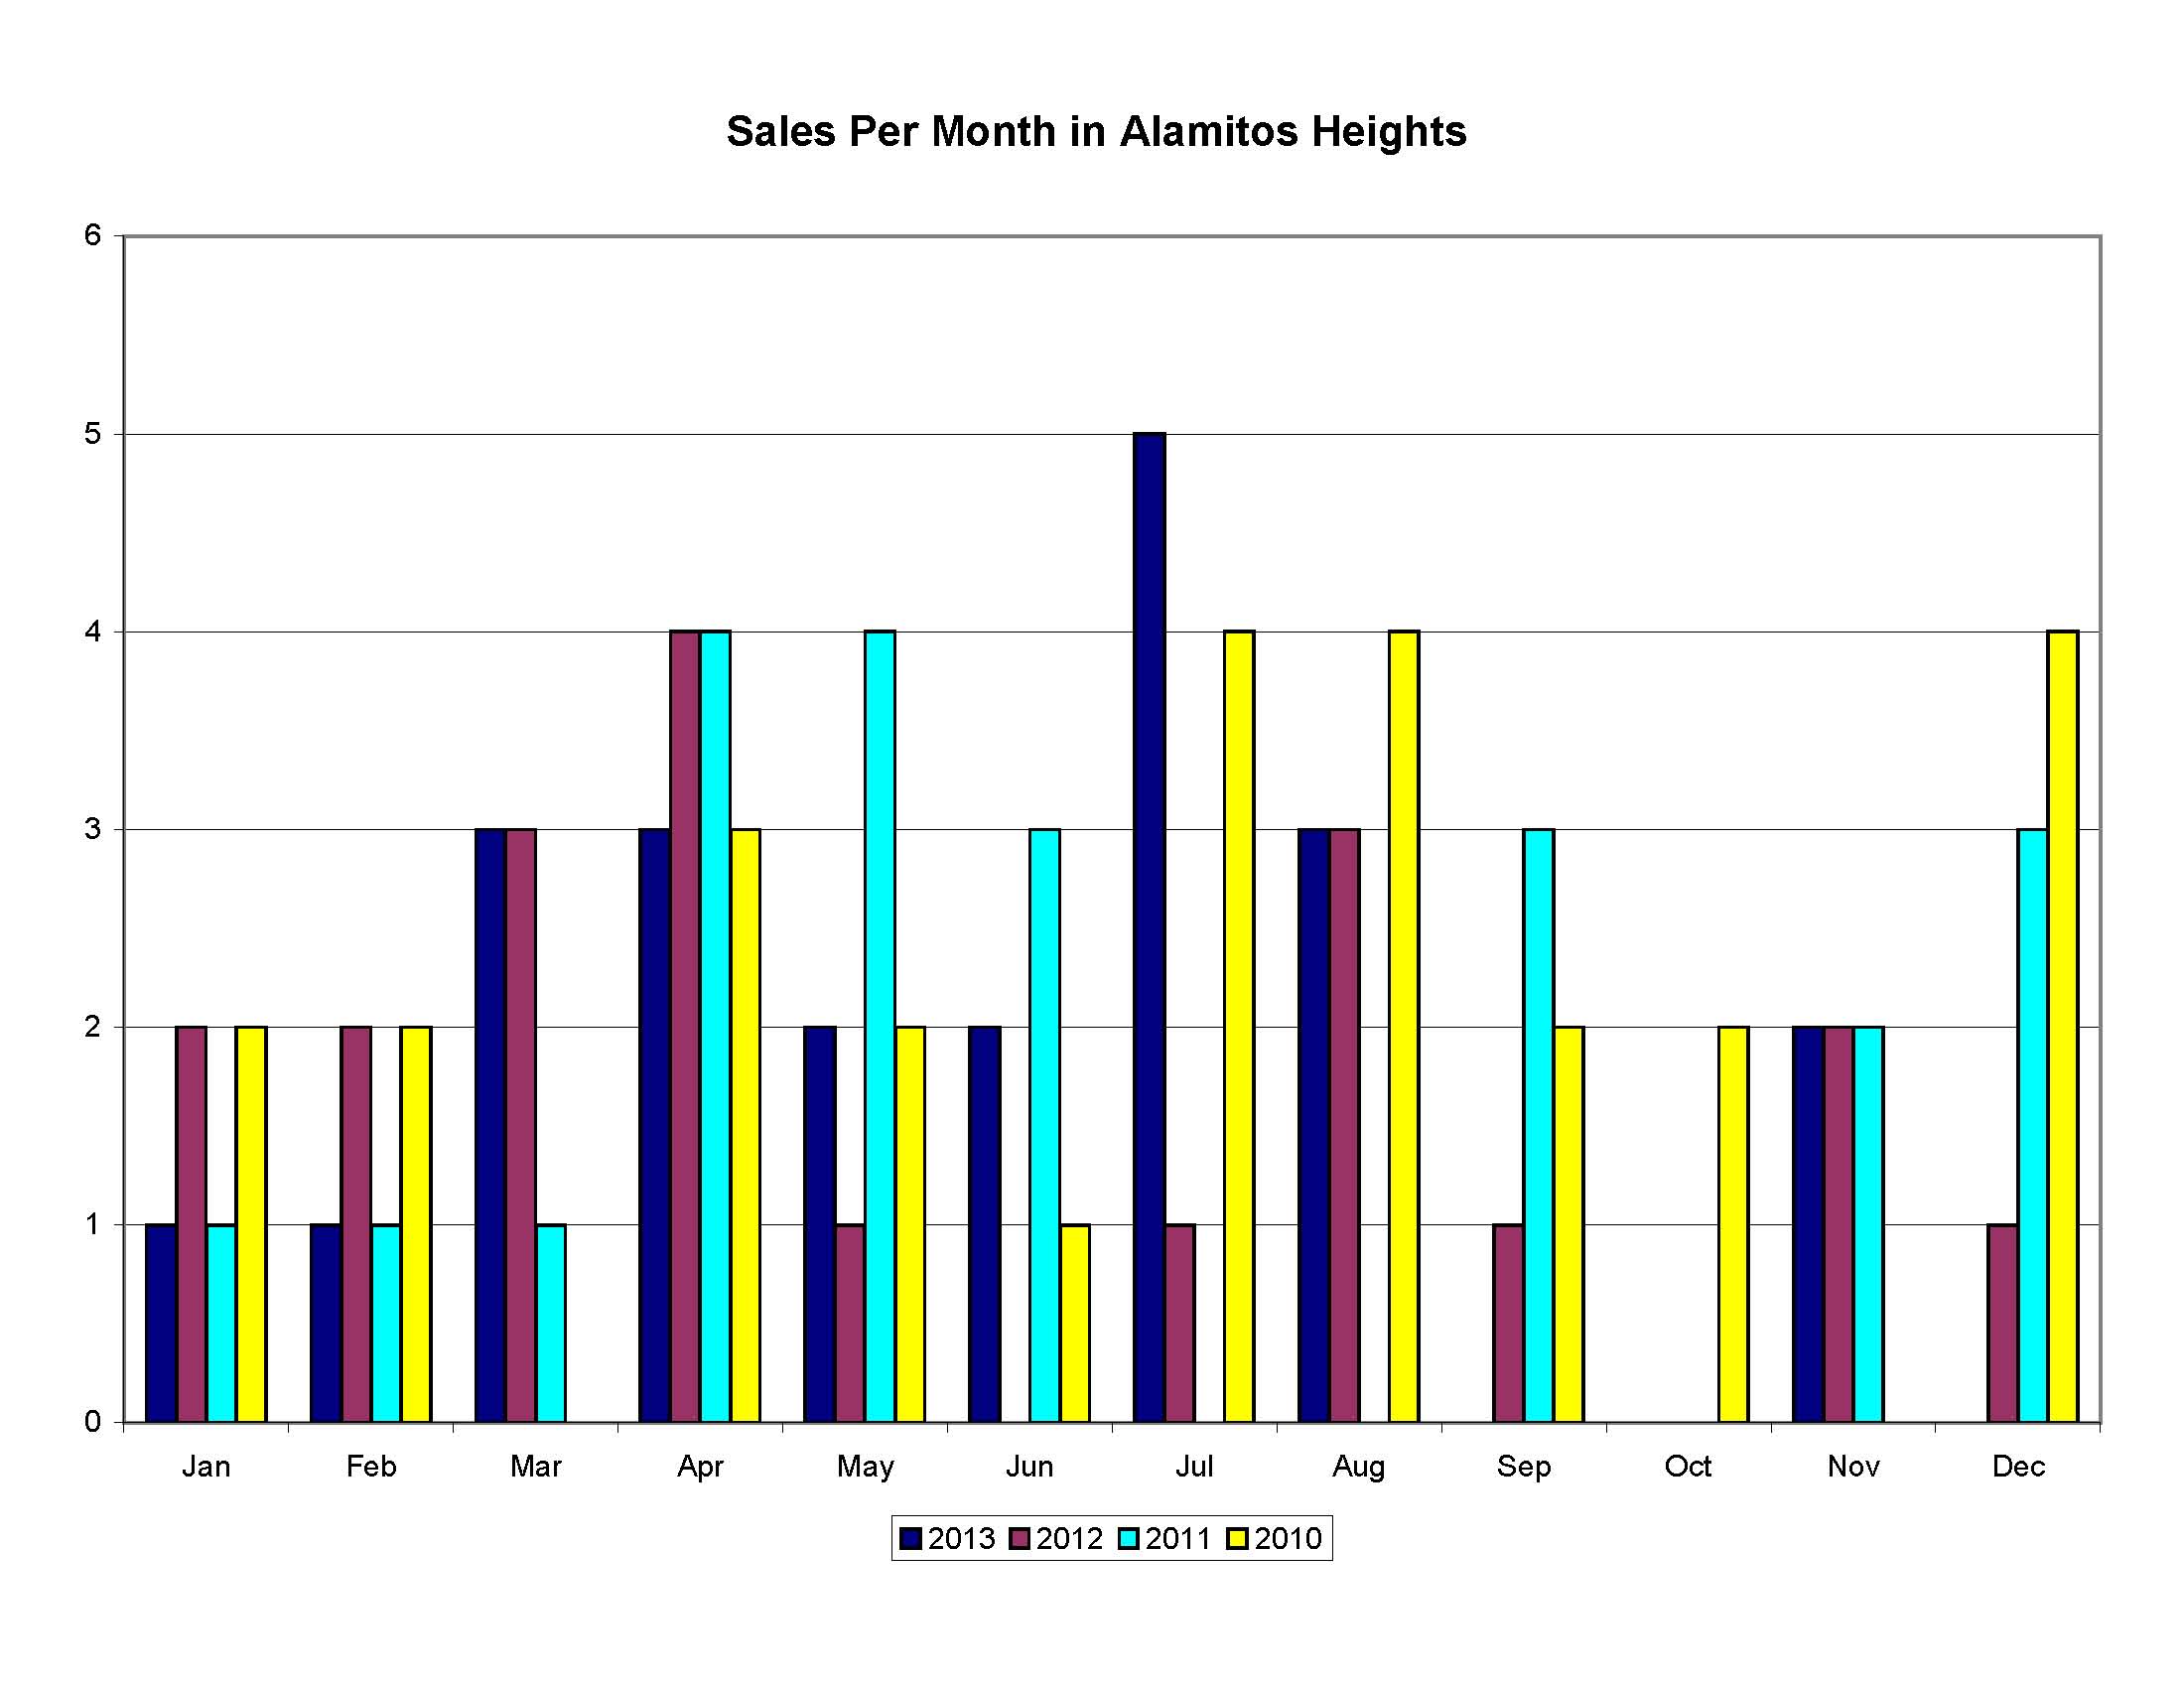
Historically, most of the sales in Alamitos Heights happen during this time. Look at the graph below. This shows that most sales happen during this time period, except for December of 2010 and 2011 which was not typical.
So what does this mean to the seller? These dates used on the graph are the date the sale closed. Keep in mind, it can take 30, 60, 90 days or more to get an offer, then it can take up to 30 days to close. Working backwards, you need to start thinking about listing your house now. Then actually putting it on the market in January or February to be ready to take advantage of this time frame.
If you are thinking about selling your house, and would like to know the current market value or discuss a sales plan, call or email me. Remember, I am a Long Beach Real Estate Agent, Certified Appraiser, and a resident of Alamitos Heights, Long Beach. I know values.

